Why Are Some Neighborhoods Hotter Than Others?
Two streets in the same city can experience very different heat. Trees, pavement, buildings, shade, and land use help explain why.
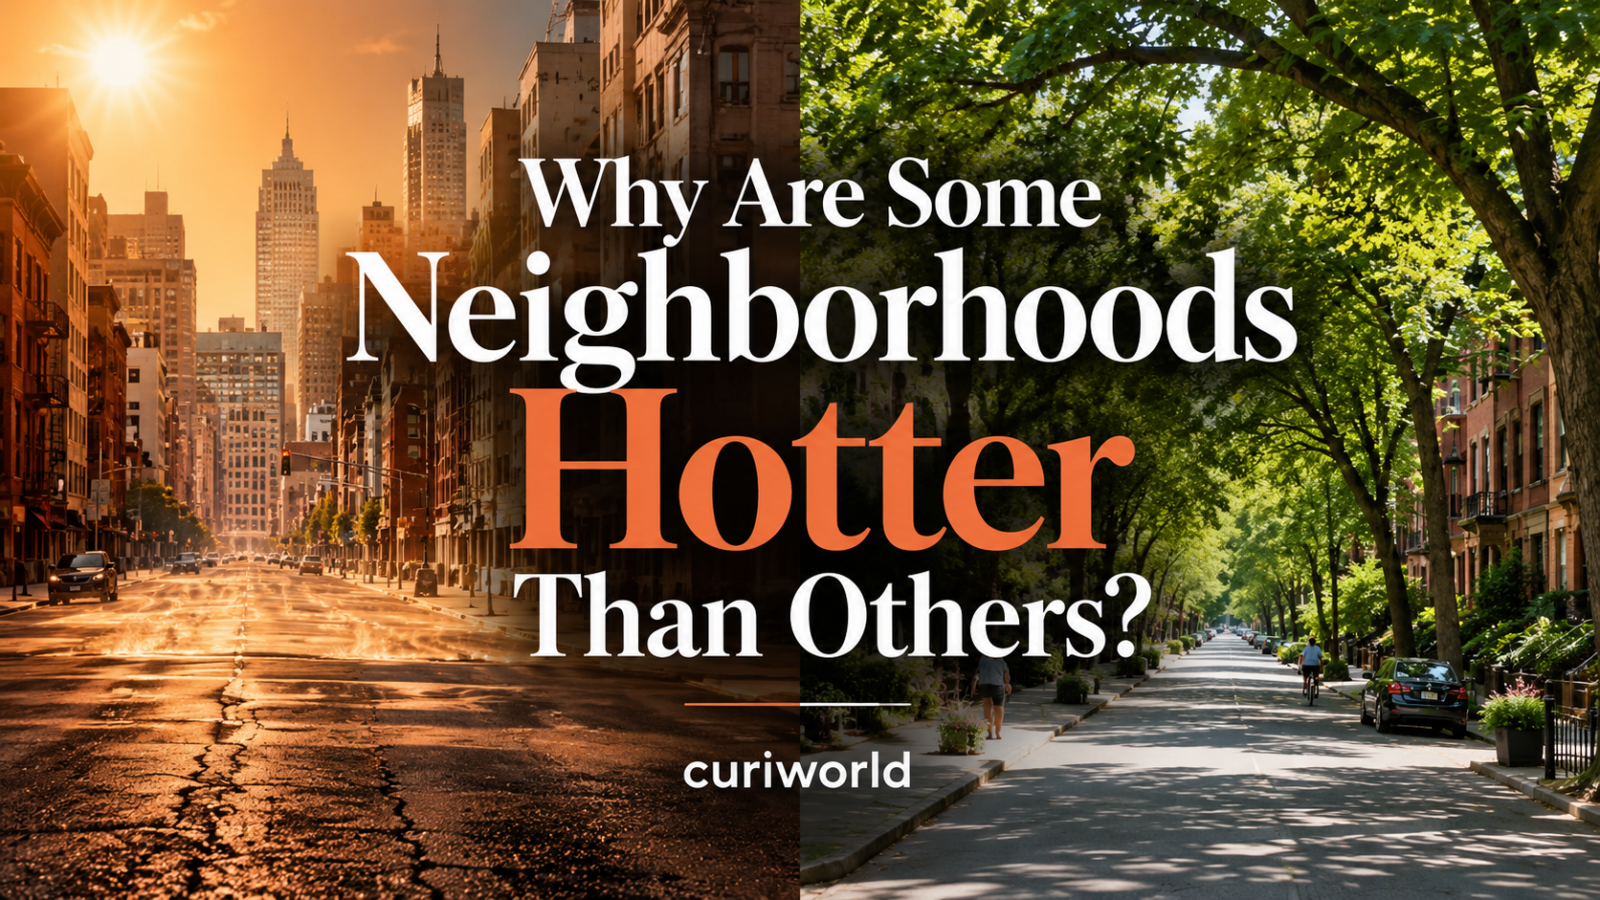
Walk ten minutes through the same city on a hot afternoon and the temperature can seem to change with the scenery.
One street is shaded by mature trees and front gardens. A few blocks away, the sidewalk is exposed to full sun, parked cars fill the curb, rooftops stretch across the block, and a large parking lot radiates heat back toward pedestrians.
Both neighborhoods are experiencing the same weather.
They are not necessarily experiencing the same heat.
Cities contain their own small-scale climates, and differences in trees, pavement, buildings, shade, traffic, and land use can make one neighborhood noticeably hotter than another. This variation is part of the broader urban heat island effect, but it happens at a much finer scale than the simple idea that cities are hotter than the countryside.
Curiworld has explored the wider phenomenon in Cities Stay Hot After Sunset: The Urban Heat Island Effect Explained. At neighborhood level, however, the important question becomes more specific: why can two places only a few blocks apart feel so different?
A city can contain hot spots within the heat island.
The Biggest Difference May Be What Covers the Ground
Look at a hot neighborhood from above and one feature often stands out: how much of the surface is covered by roofs, roads, sidewalks, and parking lots.
These hard surfaces behave very differently from vegetation.
Trees, grass, soil, and other natural landscapes can cool their surroundings through shade and the movement of water from plants into the atmosphere. Pavement and buildings provide much less of that cooling.
Instead, many common urban materials absorb solar energy during the day.
A large parking lot, dark roof, or unshaded road can therefore become much hotter in direct sunlight than a nearby vegetated area.
The U.S. Environmental Protection Agency identifies reduced vegetation and the thermal properties of urban materials as two major causes of heat islands. Roads, roofs, sidewalks, and buildings can absorb and later release heat that would be handled differently in a greener landscape.
That means two neighborhoods separated by only a few streets can develop different thermal environments simply because their surfaces are different.
Trees Work Like Neighborhood Cooling Infrastructure
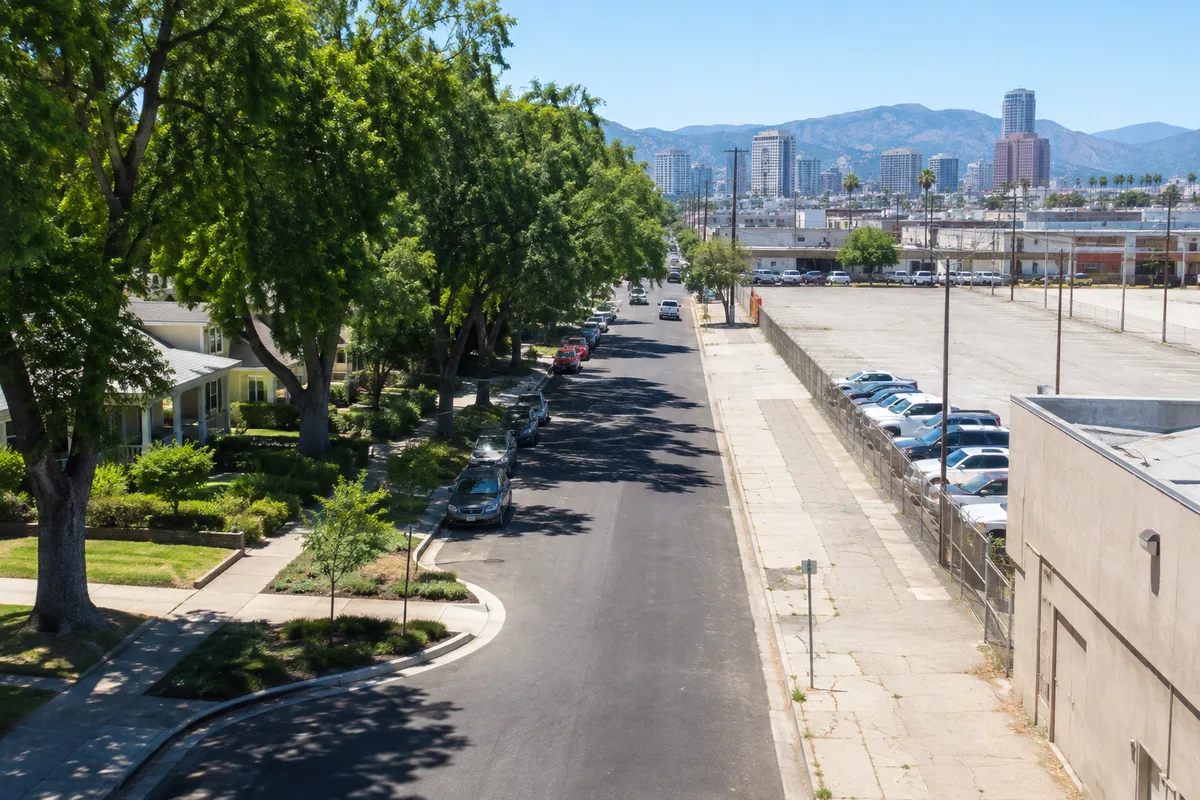
Trees do much more than make a street look greener.
Their first cooling effect is easy to understand: shade.
A tree canopy blocks some incoming solar radiation before it reaches sidewalks, walls, parked cars, playgrounds, and people.
But shade is only part of the story.
Trees also cool their surroundings through evapotranspiration. Water absorbed through roots eventually moves through the plant and is released from leaves. Evaporating that water requires energy, which helps cool the surrounding environment.
According to the EPA, a review of 308 studies found that urban forests were, on average, about 3°F (1.6°C) cooler than urban areas without green cover.
That does not mean planting a few trees automatically lowers every neighborhood by exactly 3°F. Cooling depends on climate, tree species, canopy size, soil moisture, placement, time of day, surrounding buildings, and many other variables.
The broader lesson is much stronger: tree cover can materially change the thermal character of a neighborhood.
This is why a heavily shaded residential street can feel dramatically different from an exposed commercial corridor just a few blocks away.
Parking Lots Can Become Local Heat Hot Spots
Few urban spaces demonstrate the problem as clearly as a large parking lot.
Imagine two blocks of similar size.
One contains houses, gardens, mature trees, and shaded sidewalks.
The other contains a supermarket surrounded by an expansive paved parking area with almost no vegetation.
Both receive similar sunlight from above.
But they handle that energy very differently.
The first block has vegetation that intercepts sunlight, produces shade, and releases moisture.
The second presents a large, exposed surface directly to the sun.
That surface heats up and transfers energy to the air and surrounding environment. Cars and buildings add even more heat-absorbing surfaces.
This is one reason temperature maps of cities often reveal distinctive hot spots around industrial areas, commercial districts, highways, large rooftops, and extensive parking facilities.
The neighborhood map may look uniform.
The heat map often does not.
Buildings Can Either Create Shade or Trap Heat
Dense buildings make urban heat more complicated.
A tall building can provide valuable shade to a sidewalk.
A group of closely packed buildings, however, can also reduce airflow and create what researchers call an urban canyon.
Think of a narrow street surrounded by tall walls.
Solar energy may strike roads and building surfaces from several angles. Heat released by those surfaces can interact with nearby structures, while limited airflow may make it harder for warm air to disperse.
The EPA includes building geometry among the factors influencing urban heat. Tall buildings and narrow streets can restrict wind flow, while urban structures can affect how heat enters, moves through, and escapes from a neighborhood.
This means density itself is not automatically good or bad.
Two dense neighborhoods can behave differently depending on street orientation, building height, spacing, shade, vegetation, surface materials, and local wind patterns.
Neighborhood Heat Does Not Disappear at Sunset
The hottest-looking place at 2 p.m. is not necessarily the only place that matters.
Urban materials can store energy during the day and release some of it later.
That helps explain why developed areas sometimes remain unusually warm after sunset even after direct sunlight disappears.
Imagine a tree-lined park and an asphalt-heavy commercial district on the same summer evening.
The park benefited from shade and vegetation during the day.
The commercial district spent hours absorbing solar energy into roads, roofs, walls, and parking surfaces.
After sunset, those materials do not instantly become cool.
Some of the energy they stored is released back into the environment.
This nighttime persistence is one of the reasons the broader urban heat island effect can continue after sunset.
Neighborhood heat is therefore partly about what happens during the afternoon—and partly about how the built environment behaves once the sun goes down.
Traffic and Air Conditioning Can Add Heat Too
Not all neighborhood heat comes directly from sunlight.
Cities also generate heat through human activity.
Vehicles release heat.
Industrial equipment releases heat.
Buildings consume energy.
Air-conditioning systems move heat from inside buildings to the outdoors.
Individually, these sources may seem minor compared with the summer sun. Collectively, especially in dense commercial or industrial districts, they can contribute to local warming.
This is sometimes called anthropogenic heat—heat produced by human activities.
Its importance varies considerably between neighborhoods.
A quiet residential area with little traffic has a different energy profile from a dense district filled with vehicles, offices, restaurants, mechanical systems, and large buildings operating throughout the day.
Once again, the important point is not that every city block behaves identically.
It is that each block is part of its own physical environment.
A Highway Can Change More Than the View
Major roads can strongly reshape neighborhood landscapes.
Highways and wide arterial roads introduce enormous amounts of pavement. They may also reduce vegetation, divide existing green spaces, increase traffic, and encourage the development of parking lots, warehouses, and other heavily paved land around them.
The result can be a broad corridor with relatively little shade and many surfaces capable of becoming hot under sunlight.
Industrial districts can create similar patterns.
Large rooftops, loading areas, storage yards, paved access roads, and limited tree canopy can combine to create a very different microclimate from that of a nearby residential district.
This helps explain why heat differences do not always follow neat neighborhood boundaries.
A hot corridor may follow a highway.
A cooler zone may follow a park.
Another hot spot may appear around a warehouse district.
Urban temperature is partly a map of land use.
The Unequal Distribution of Trees Has a History
Here the story becomes more than physics.
Tree canopy, parks, wide streets, industrial land, and paved surfaces are not distributed randomly across cities.
They are partly the result of decades of investment decisions, housing policies, infrastructure projects, zoning, development, and neighborhood change.
Research in the United States has found striking relationships between historical housing discrimination and present-day tree cover.
A peer-reviewed study published in npj Urban Sustainability examined neighborhoods in 37 U.S. metropolitan areas and compared present-day tree canopy with grades assigned by the federal Home Owners’ Loan Corporation during the era of redlining.
Areas historically given the lowest grade had substantially less tree canopy decades later than areas that had received the highest grade.
Across the study, formerly D-graded areas averaged roughly 21% tree canopy, while formerly A-graded areas averaged about 41%.
The researchers emphasized that their analysis could not identify a single causal pathway. Cities are complicated, and neighborhood landscapes have changed in many ways since the 1930s.
Still, the association illustrates an important principle:
The temperature of a neighborhood can reflect decisions made long before the people walking its streets today were born.
Heat is not only a weather phenomenon.
It can also be an infrastructure and planning phenomenon.
The full peer-reviewed research is available through npj Urban Sustainability.
A Park Can Create a Cool Pocket Inside a Hot City
Urban heat does not increase smoothly from the suburbs to downtown.
Green spaces can interrupt the pattern.
A large park introduces trees, vegetation, soil, and shade into an otherwise heavily developed landscape. Water features may contribute additional localized cooling under some conditions.
That can produce what is sometimes described as a park cool island—a relatively cooler area inside the surrounding urban environment.
You may notice the effect without ever measuring it.
Walk from an exposed sidewalk into a mature tree canopy on a hot afternoon and the change can feel immediate, even though the official weather station still reports exactly the same city temperature.
That distinction reveals a limitation of ordinary weather reports.
Your Weather App Cannot Describe Every Street
When an app says it is 95°F in a city, it is not measuring the air directly outside every resident’s front door.
Weather observations come from specific monitoring locations and are intended to represent broader atmospheric conditions.
They cannot capture every parking lot, shaded street, courtyard, industrial zone, rooftop, park, and highway interchange.
Urban heat researchers therefore use several approaches to understand neighborhood differences, including fixed sensors, mobile temperature measurements, satellite observations, and land-surface temperature mapping.
These methods do not all measure exactly the same thing.
A satellite may measure surface temperature, while a thermometer measures air temperature.
That difference matters.
A sun-baked road surface may reach a much higher temperature than the air above it. Surface-temperature maps are extremely useful for revealing heat patterns, but they should not automatically be interpreted as the temperature a person would see on a standard weather thermometer.
Understanding the distinction prevents dramatic-looking heat maps from being misread.
Why Doesn’t the Hottest Neighborhood Stay the Hottest All Day?
Neighborhood heat patterns can change by the hour.
A street facing the morning sun may be shaded later.
Tall buildings may block direct sunlight from one area while exposing another.
Wind may increase.
Clouds can arrive.
Traffic patterns change.
Vegetation responds differently depending on water availability.
Surfaces also heat and cool at different rates.
For that reason, asking “Which neighborhood is hottest?” is sometimes less useful than asking:
Hottest when?
The answer at 3 p.m. may not be the same as the answer at midnight.
It can also change with the season.
Can Cities Cool Their Hottest Neighborhoods?
Yes, although there is no single solution that works everywhere.
Strategies include increasing tree canopy, protecting existing mature trees, creating parks and smaller green spaces, installing green roofs, using more reflective roofing and paving materials, adding shade structures, and redesigning streets and public spaces with heat in mind.
The best combination depends heavily on local conditions.
Trees need sufficient soil, water, maintenance, and space.
Highly reflective surfaces must be selected and placed appropriately.
A dense commercial district has different possibilities from a suburban residential neighborhood.
And planting trees today does not create a mature canopy tomorrow.
That is why neighborhood heat planning is increasingly about identifying where cooling will make the greatest difference, rather than simply applying the same solution everywhere.
The City Has More Than One Temperature
A city may have one temperature printed on the weather forecast, but residents experience heat at street level.
That experience is shaped by what surrounds them.
A mature tree can block sunlight.
Grass and vegetation can help cool the environment through evapotranspiration.
A parking lot can absorb large amounts of solar energy.
Buildings can create shade or restrict airflow.
Roads, rooftops, traffic, and industrial land can change how energy moves through a neighborhood.
Even decisions made generations ago can influence where trees and paved surfaces exist today.
So when one neighborhood feels dramatically hotter than another only a few blocks away, you are not necessarily imagining it.
The weather may be citywide.
The heat can be intensely local.
Sources
U.S. Environmental Protection Agency — What Are Heat Islands?
https://www.epa.gov/heatislands/what-are-heat-islands
Locke, D. H., Hall, B., Grove, J. M., et al. — Residential Housing Segregation and Urban Tree Canopy in 37 US Cities — npj Urban Sustainability (2021)
https://www.nature.com/articles/s42949-021-00022-0






Join the discussion